What is Net Promoter Score (NPS)? Calculation, Benchmarks, and NPS Tools
Net Promoter Score®, or NPS®, is an index for understanding customer loyalty, and is the numerical average of how likely customers are to recommend your products or services to a their friends.
The NPS® (Net Promoter Score) was originally proposed by Fred Reichheld, a fellow at the American consulting firm Bain & Company.
Table of Contents
What is the Net Promoter Score (NPS)?
Net Promoter Score (NPS) is a metric that is used in some customer experience programs to measure customer loyalty. NPS is based on a single-question survey, which asks:
“How likely is it that you would recommend
[product/service/organization] to a friend or colleague?”
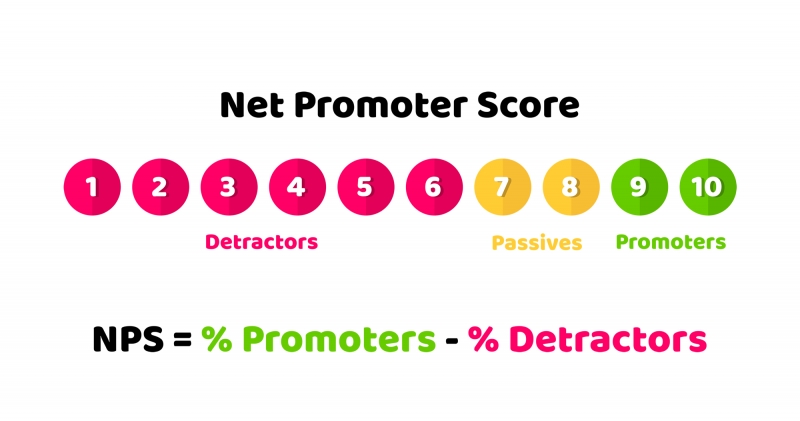
You must rate how likely it is on a scale of 0 (not likely at all) to 10 (extremely likely). Depending on their answer, the surveyee will be grouped into one of three categories- either Promoters, Passives or Detractors (described in detail in the next section).
NPS was first put forward by Fred Reichheld, a fellow at the US consulting firm Bain and Company, in his book The Ultimate Question.
When using NPS, note that the score only reflects customer loyalty at that point in time. To understand the bigger picture, NPS needs to measured on a regular basis, instead of focusing on the results of a single survey.
How to Calculate Net Promoter Score (NPS)
1. Conduct a survey asking the NPS question: “how likely is it that you would recommend our service/brand to a friend or colleague?
The survey could be created on a generic survey software, but if you opt for a Customer Experience Management tool, then you can gain a more holistic view of the data, alongside all the past interactions a customer has had with your brand.
Next, while NPS is defined as a one-question survey, you should still include demographic questions at the beginning, to collect data on their age, gender, location, income, etc.
We also recommend adding a field to ask the reason why they chose that score. This will give you valuable insight into what your customers are satisfied with versus what they think needs improvement.
2. Divide the respondents into Promoters, Passives, and Detractors.
Promoters are respondents who rated you 9 or 10. This group has the highest loyalty to your brand.
Passives are those who rated you 7 or 8. This group are not particularly loyal fans and will easily buy from one of your competitors if it suits them. However, they also don’t hold negative or critical views about your business or products, and aren’t likely to post a bad review online.
Detractors include everyone who rated you between 0-6. There is a strong possibility that members of this group may leave negative reviews of your brand online.
3. Determine the percentages of Promoters and Detractors, respectively.
Next, calculate the total percentage of both the Promoter group and the Petractor group. For example, if you surveyed 100 people, and 20 of them answered 9 or 10, then 20% are Promoters.
4. Subtract the percentage of Detractors from the Promoters.
Let’s say, on top of the previous example, that 50% of the 100 respondents answered somewhere between 0-6. Then subtract that 50% from the percentage of Promoters, 20%, and you end up with a NPS of -30%.
The Difference from CSAT (Customer Satisfaction)
While NPS is an index that measures customer loyalty, it is not to be confused with CSAT (short for Customer Satisfaction Score) - a similar index that measures customer satisfaction.
What is CSAT (Customer Satisfaction Score)?
CSAT quantifies the level of customer satisfaction with a certain product/service, and the method of measurement varies from company to company.
For example, customers are asked questions like, “Are you satisfied with [XX product]?” and must answer on a scale of 1-5 or 1-10. Then the ratings are averaged to get the final CSAT.
When should you use CSAT vs. NPS?
This depends on what you want to find out. CSAT is often measured before and after a product has been updated, to check the reactions of their users. On the other hand, NPS can be used to see the likelihood of your current customer base switching to a competitor’s products, in order to evaluate that risk.
What’s a good NPS score?
Let’s refer to the results of Temkin Group’s Benchmark Study (2018), which analyzes the NPS of 342 companies across 20 industries.
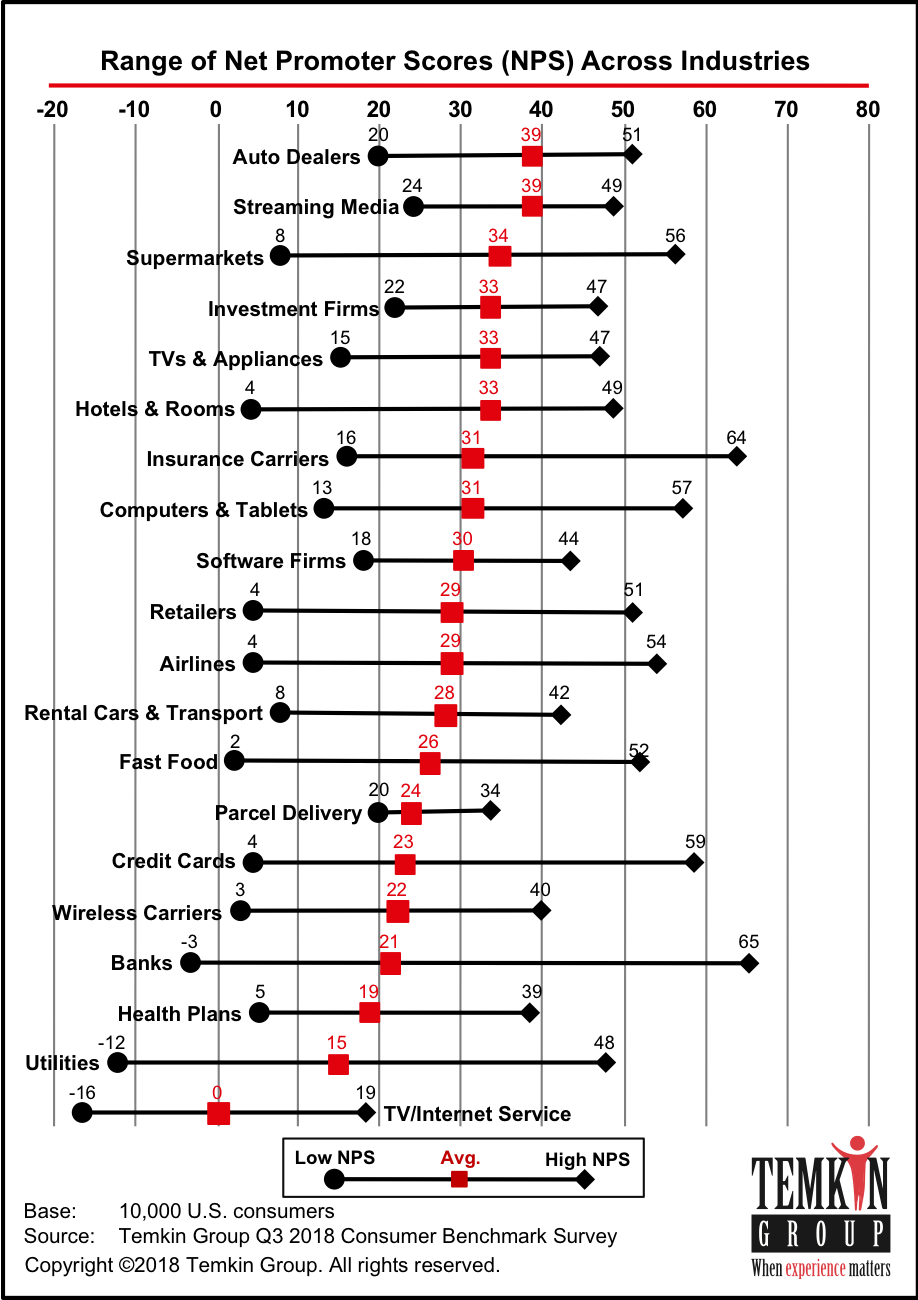
As you can see, the average varies widely depending on your industry. USAA’s banking business received the highest score in the study at 65, while Spectrum (TV/Internet Service) and Consolidated Edison of NY (Utilities) saw the lowest at -16 and -12.
You should aim to beat the average for your industry to stay competitive. For instance, if you’re in the Credit Card industry, aim for anything above the NPS score of 25.
NPS Benchmarks of Fortune 500 companies
If you’re curious as to where the major multinational American companies end up on the NPS scale, check out their public scores:
| 1. Walmart | General Merchandisers | -4 |
| 2. Exxon Mobile | Petroleum Refining | 2 |
| 3. Chevron | Petroleum Refining | 4 |
| 4. Berkshire and Hathaway | Insurance | -6 |
| 5. Apple | Consumer Electronics | 45 |
| 6. General Motors | Motor Vehicles and Parts | 6 |
| 7. General Electric | Manufacturing | 20 |
| 8. Ford Motor | Motor Vehicles and Parts | 9 |
| 9. CVS Health | Food and Drugstores | -5 |
| 10. AT&T | Telecommunications | 15 |
See the rest of the NPS benchmarks here.
NPS Survey Tools
SurveySparrow
SurveySparrow is an omnichannel customer experience management platform that can be used to measured NPA, CSAT, and another metric callet CES (Customer Effort Score). You’re able to create conversational surveys in any language, and then identify underlying patterns and predict trends with the Business Intelligence feature. SurveySparrow also makes possible a wide range of integrations, with tools like Slack, Microsoft Teams, Google Analytics, Google Ads, Salesforce, and more.
Qualtrics
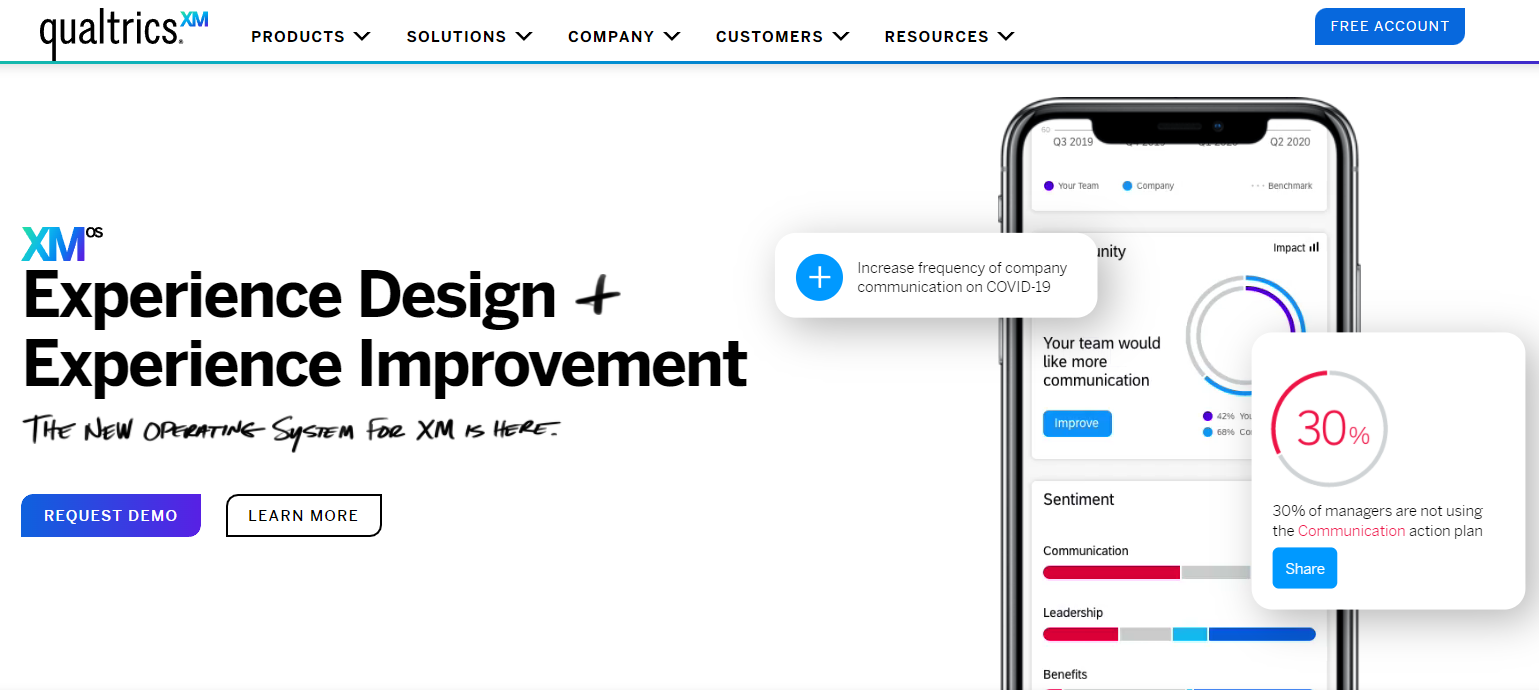
Qualtrics is another great, multi-function Customer Experience Management Tool to consider. To prevent customer churn, Qualtrics automatically recommends actions to the appropriate team in the tool they use. Like SurveySparrow, Qualtrics also lets you integrate pretty much any tool you could think of to integrate, and manage a wide range of customer data in a centralized location.
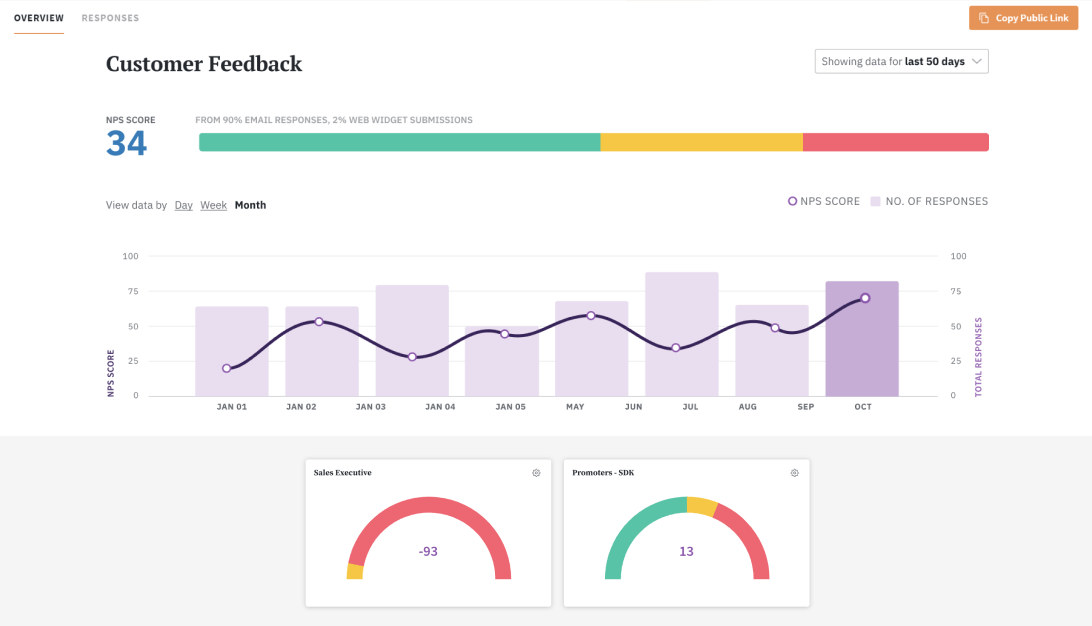
Promoter.io
If you’re not looking for a million integrations and want to focus on only the pertinent data, I suggest the no-frills option of Promoter.io. It’s relatively cheap and you can start on their free plan to see if it fits your business. Promoter.io also offers customer support in 27 languages, so no matter where you are, you’ll most likely be able to get guidance on how to operate the tool.
Conclusion
The NPS score system is one of the most important tools for measuring customer experience. It is unique in that it can track change over time, gives you insight into the bigger picture, and is easy to benchmark against competitors. Most of all, NPS can help you by bringing attention to glaring issues in the customer experience you’re providing, so that you can quickly fix them and lower your churn rate.
.jpg)
.jpg)
.jpg)